Active badges

Security operations analytics
GateWatch
A command-center dashboard for badges, drive-in access, gate statistics, parking counts, corporate population, contractor manhours, and inbound facility analytics.
Security operations overview
Total contractors
Elevated Dynamics employees
Supervisor drive-in
Highest exposure

Total drive-in scans
Parking avg / day
Monthly contractor hours
Built around site questions
Turn security feeds into an operations picture.
GateWatch translates badge data, gate scans, parking counts, and attendance records into views that site security, operations, and leadership can use without rebuilding their workflows.
Access control visibility
Monitor badge inventory, upcoming deactivations, drive-in permissions, visitor access, and exception patterns in one security operations view.
Parking and facility demand
Capture vehicle counts by monitored lot and compare trends across visitor entrance, delivery gate, contractor parking, garage, and contractor gate.
Contractor labor intelligence
Roll attendance activity into company, site, gate, and monthly manhour summaries with drill-down tables for audit-friendly review.
Application modules
Purpose-built views for daily security operations.
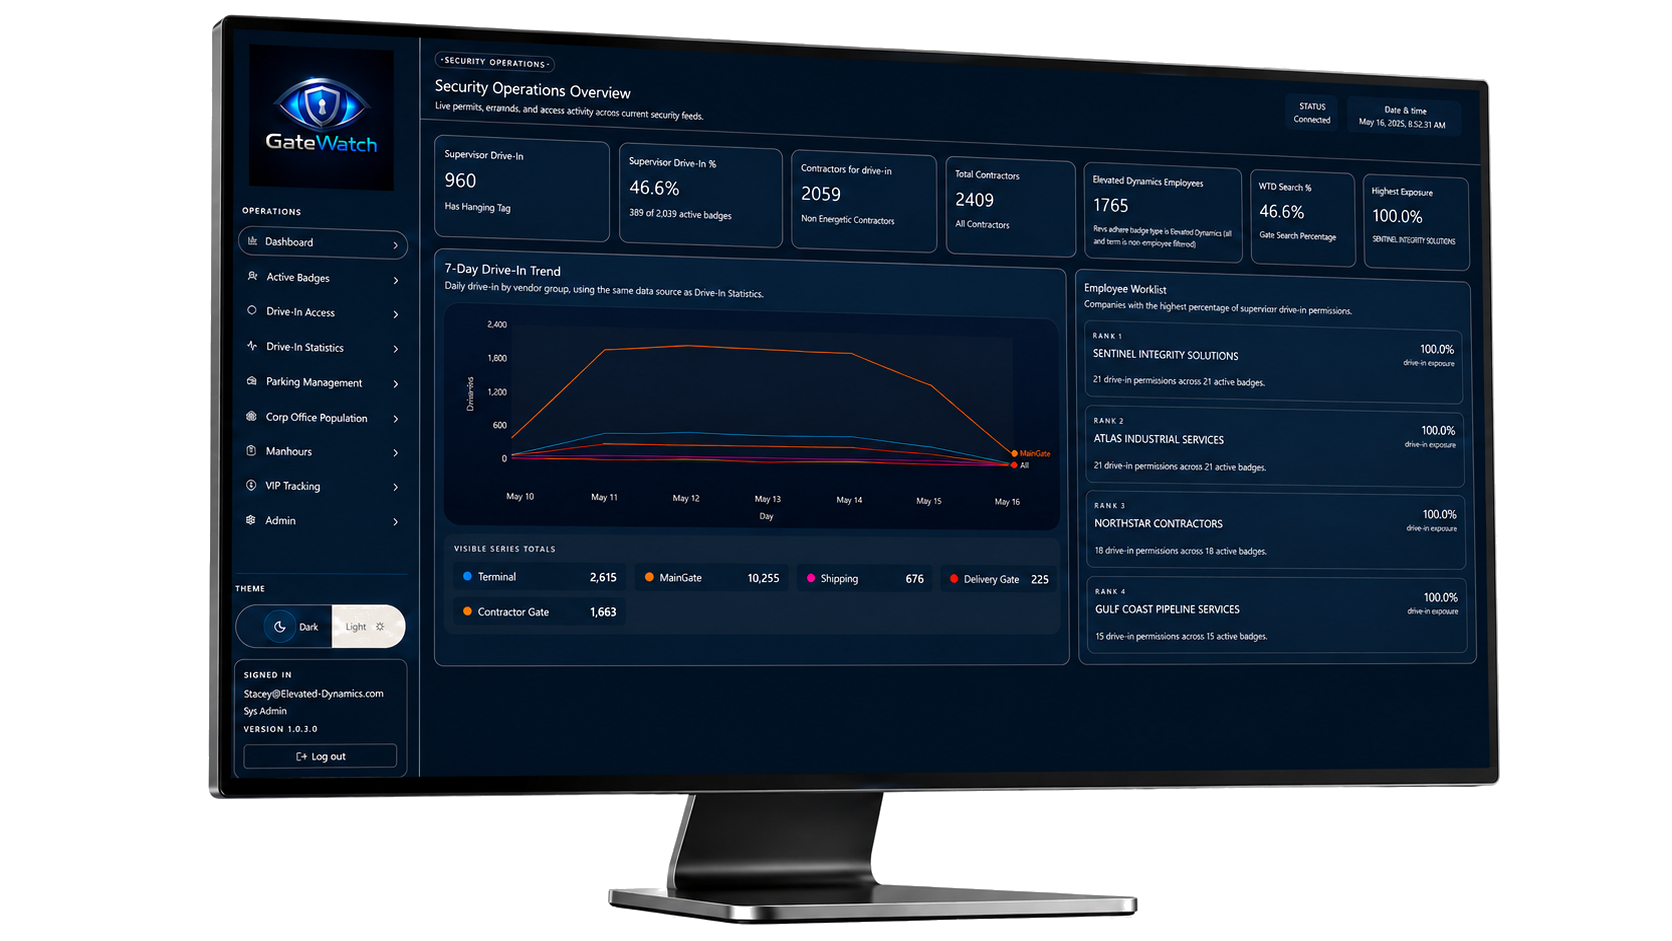
Security Operations Overview
GateWatch starts with a live security summary: supervisor drive-in counts, contractor exposure, employee counts, and a 7-day drive-in trend by vendor group.
960 Supervisor drive-in
46.6% Drive-in rate
2,409 Total contractors
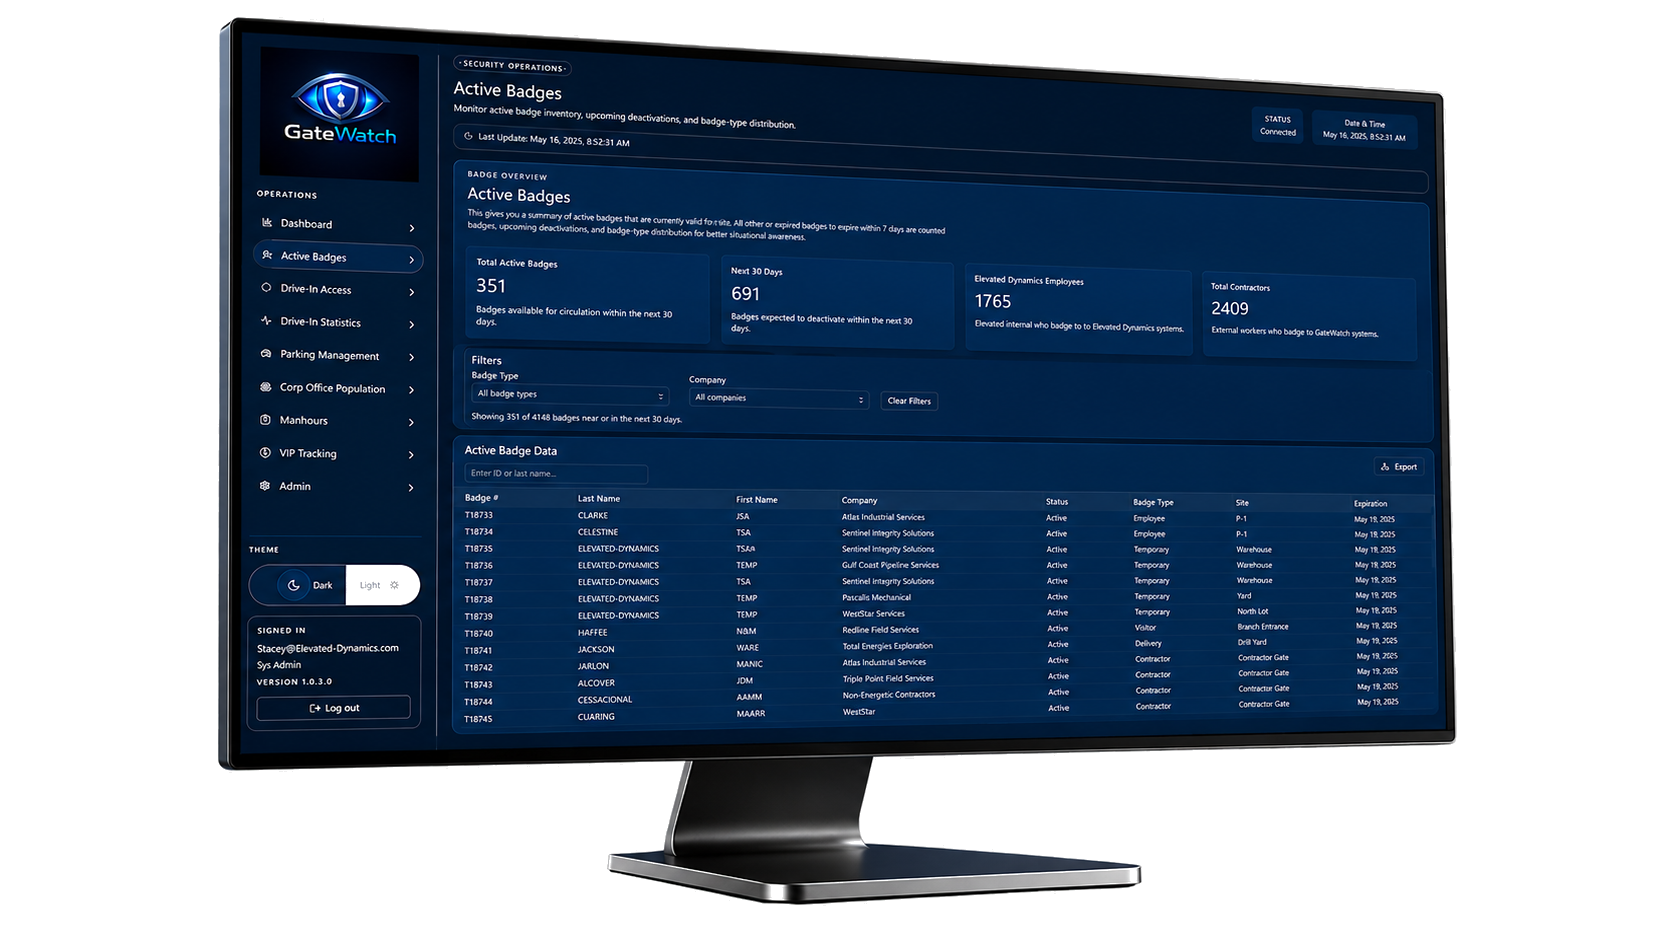
Active Badges
The active badge view gives security teams a searchable list of valid badges, expirations, badge types, companies, sites, and upcoming deactivations.
351 Active badges
691 Next 30 days
2,409 Contractors
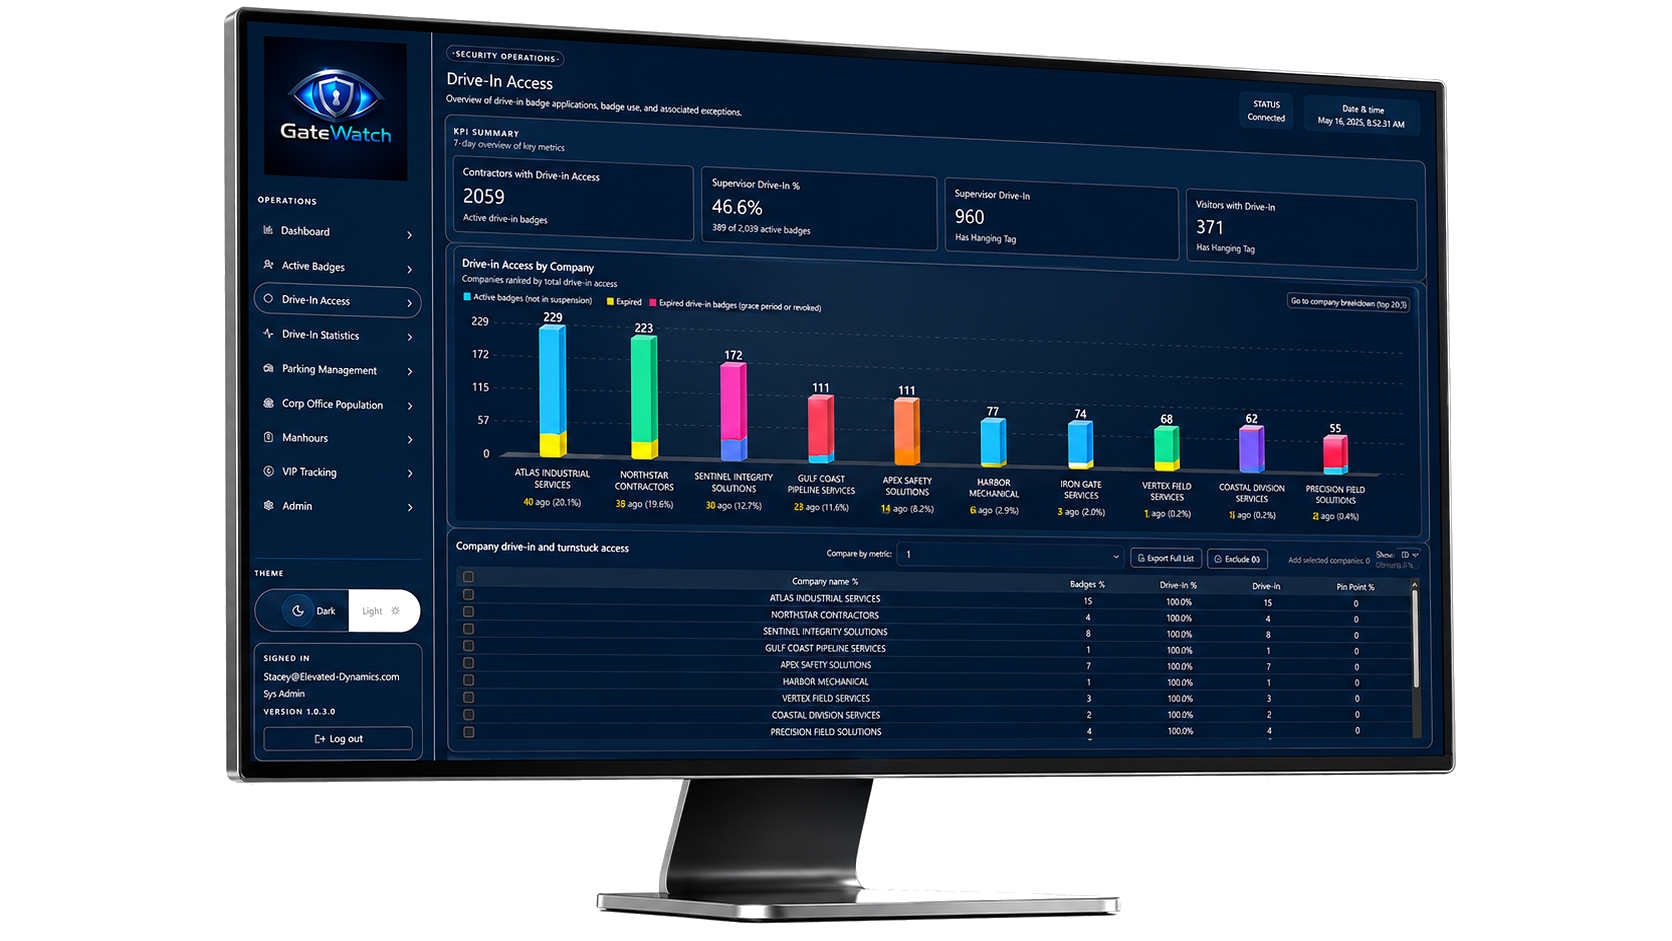
Drive-In Access
Break down drive-in badge permissions by company, expired status, grace-period badges, and revocations so teams can act before access becomes a risk.
2,059 Drive-in contractors
960 Supervisor drive-in
371 Visitors
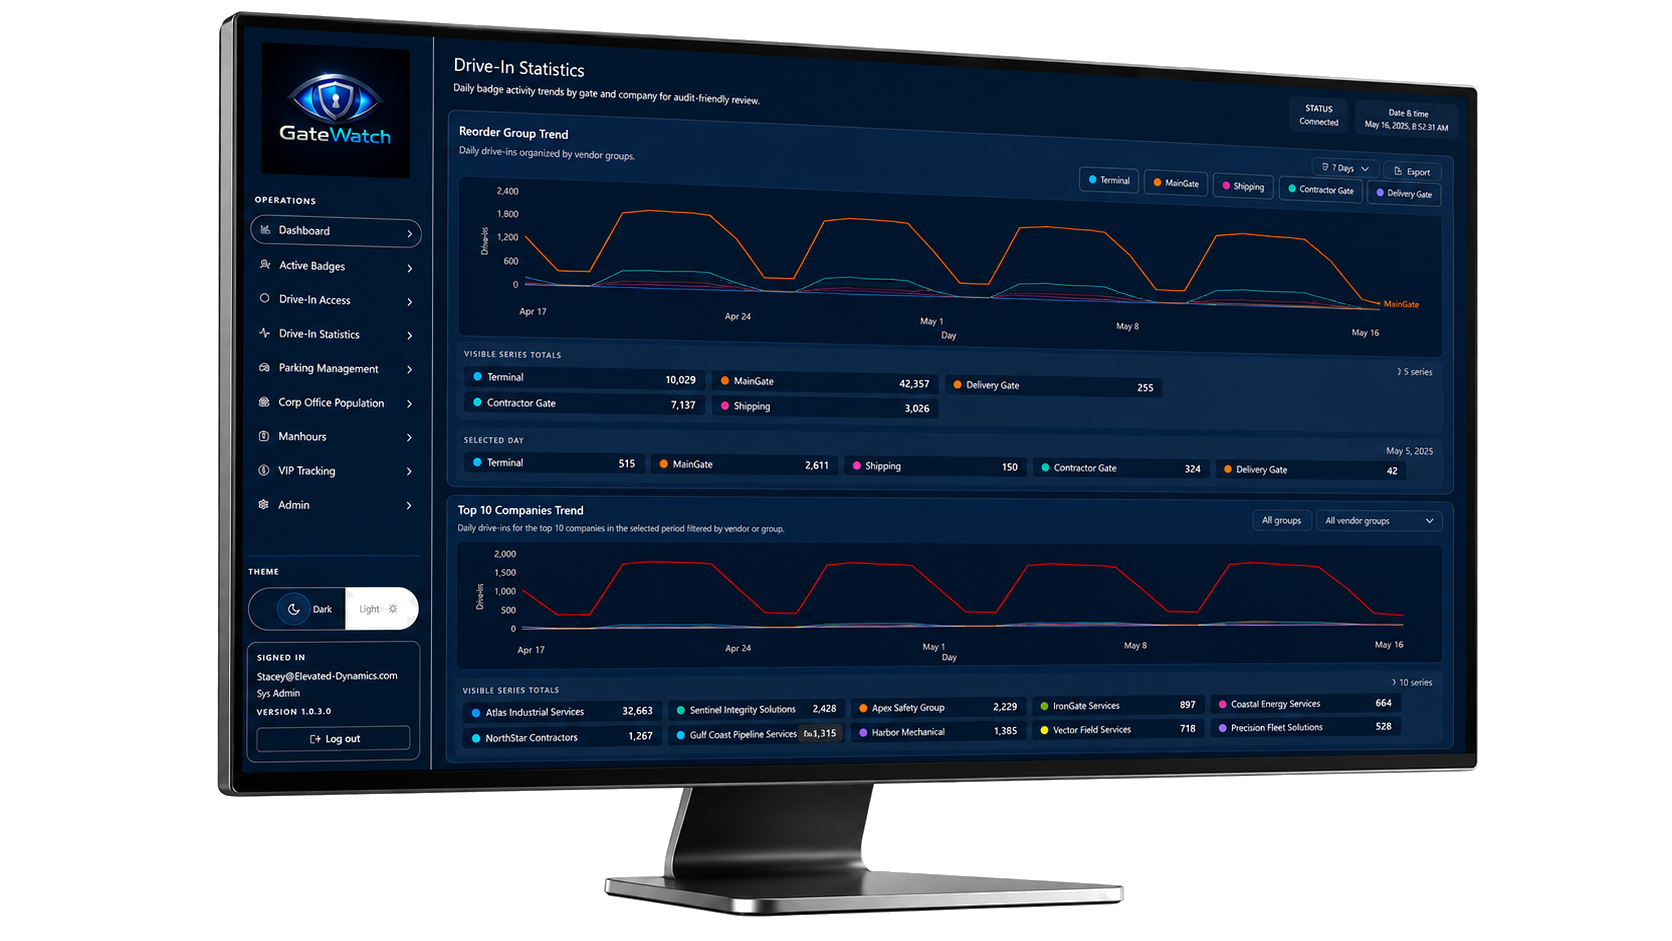
Gate and Company Trends
Trend drive-in activity by gate, delivery lane, shipping, contractor gate, and vendor group for daily audit review and operations planning.
62,764 Total scans
3,704 Distinct entries
261 Unique companies
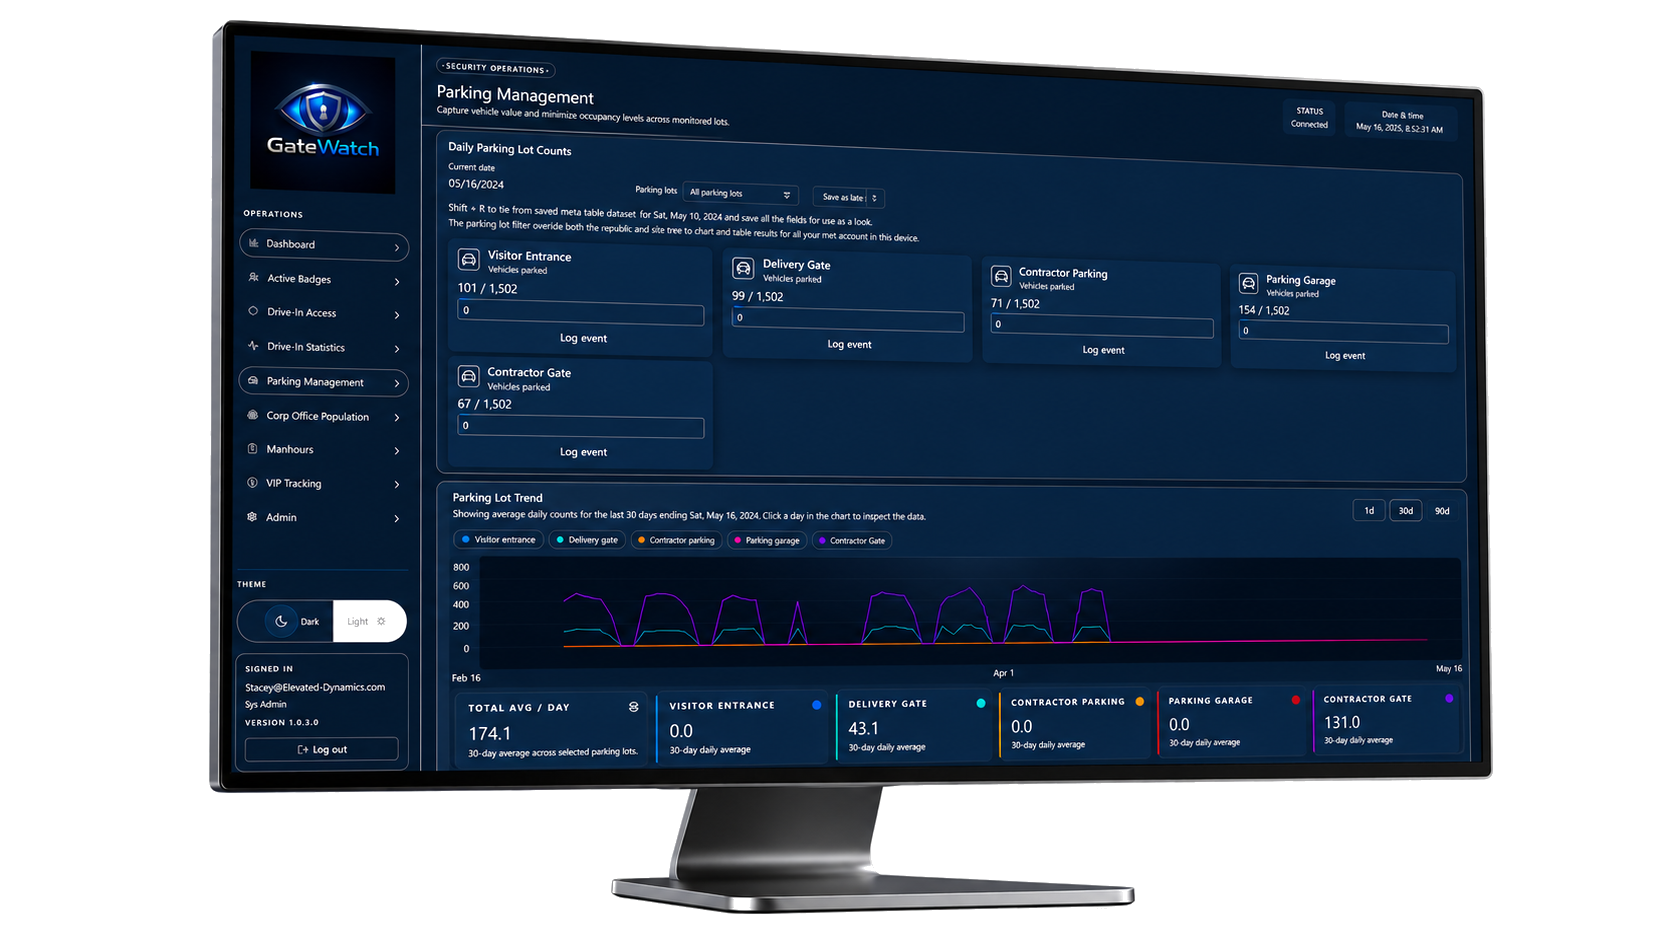
Parking Management
Capture vehicle volume across monitored lots, log daily counts, and compare 30-day parking trends across each entry point.
174.1 Total avg / day
43.1 Delivery gate
131.0 Contractor gate
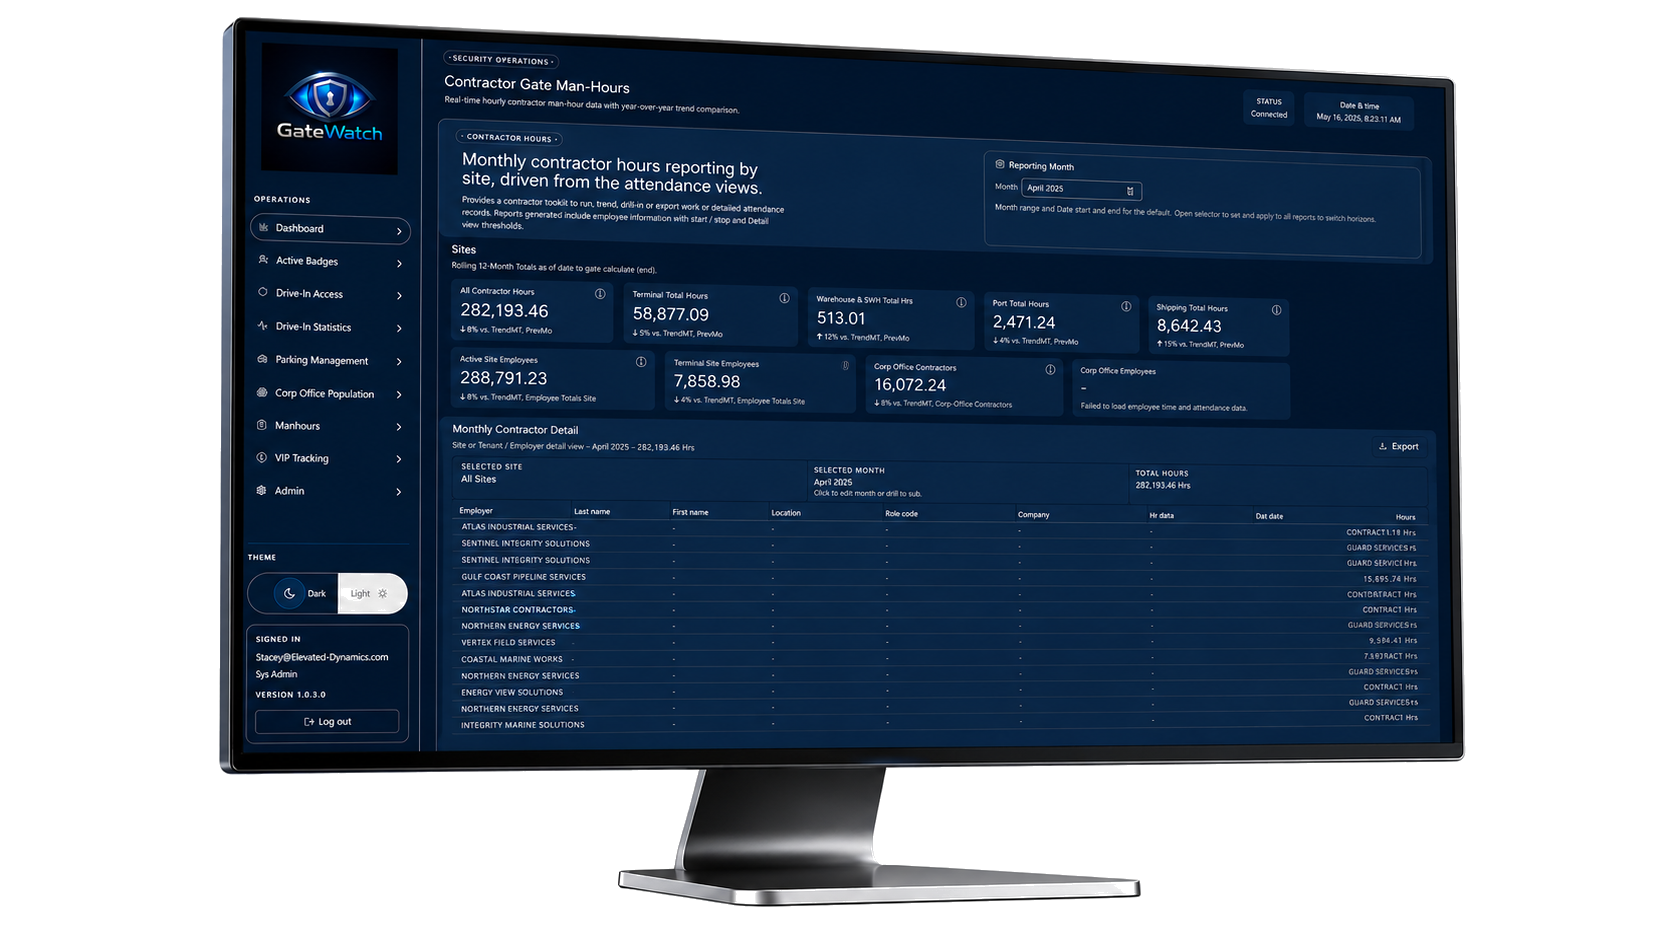
Contractor Hours Reporting
Review monthly contractor hours by site, gate, company, and worker detail, then export the results for reporting and validation workflows.
228,193 Monthly total
58,877 Main gate
8,642 Shipping
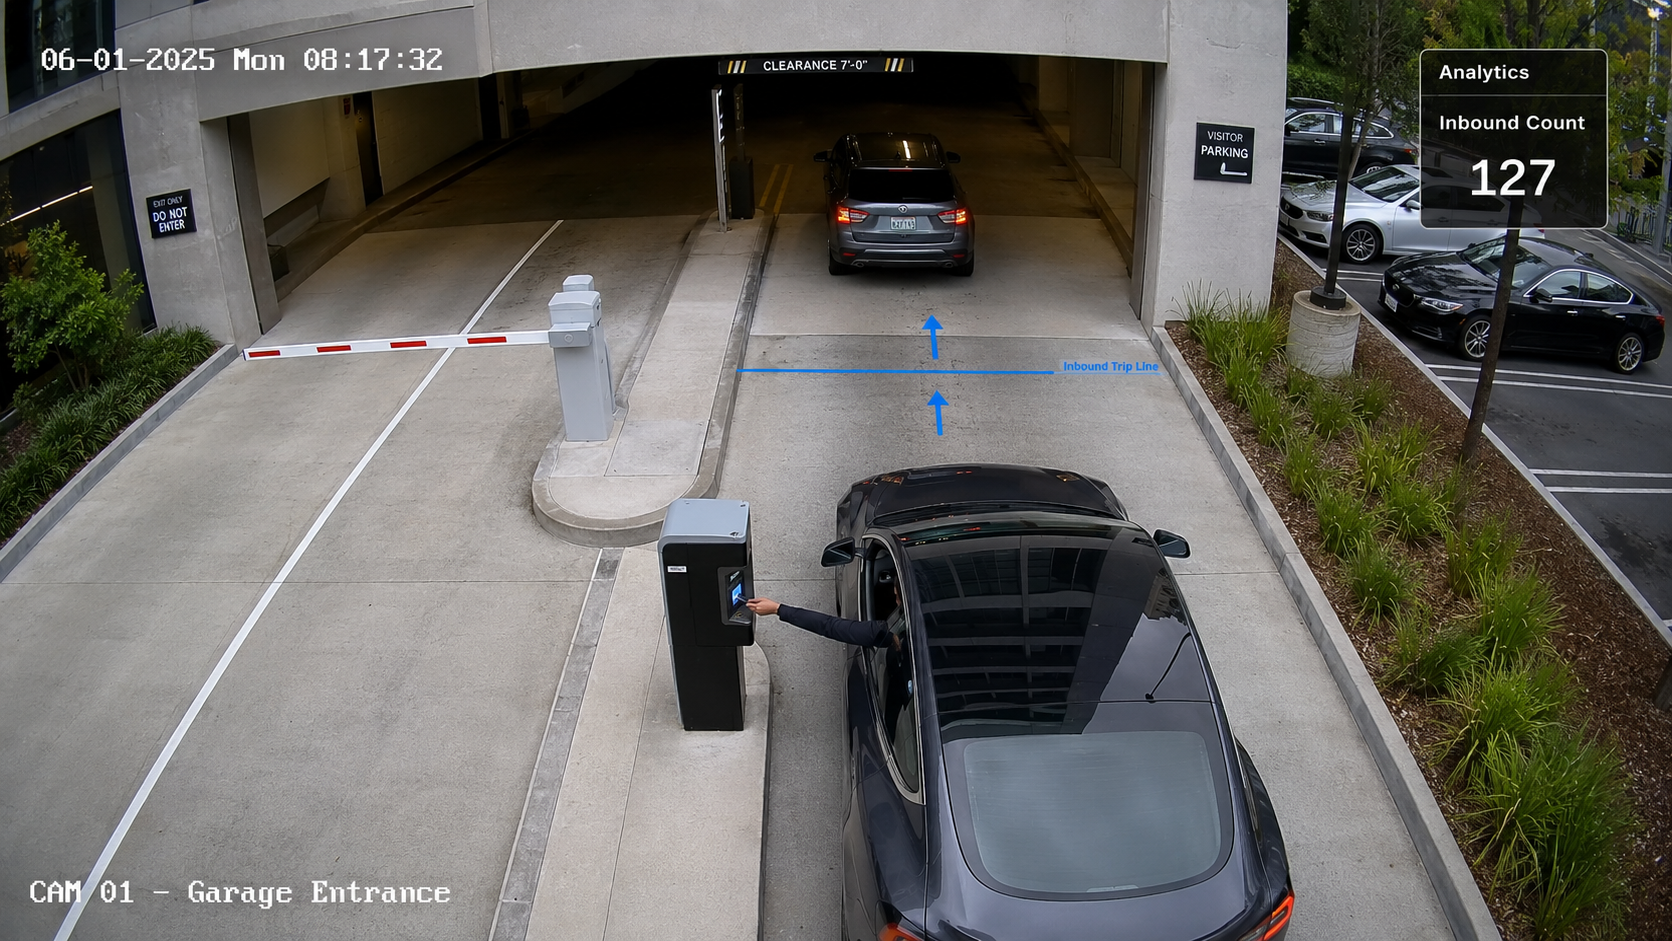
Inbound analytics
Extend dashboard visibility from badge scans to physical movement.
GateWatch can pair dashboard reporting with camera-style inbound analytics, giving teams a clearer picture of vehicle flow, entry timing, and count activity at monitored access points.
Inbound count
Trip lines
Parking flow